


Earth.Org’s Data Analyst and Visualization Expert Madina Tussupova uncovers the patterns, causes, and real consequences of global temperature rise.
—
Instead of exploring average temperature data, this article looks at temperature anomalies; in other words, deviations from average temperatures. Why is it more useful? Because the “normal” temperature range for each location is widely different – by looking at anomalies, we can effectively measure the temperature trend while avoiding climate bias.
References to global warming in this article include both land and ocean warming. The decision to not overlook ocean warming makes sense, as 90% of global warming occurs in the ocean.
Historical Temperature Trends
Historical records from the mid-20th century indicate a steady rise in average temperatures. While natural climate variability has caused certain fluctuations, the general trend has been a consistent warming.

Our analysis show the following observations:
- The global average surface temperature has risen by approximately 1.5C since 1924.
- The global warming rate of this century (1924-2024) is approximately four times higher than the rate observed in earlier years (1850-1923), emphasizing a significant acceleration in climate change during the last century [linear regression was used to calculate the slopes]
- The 21st century has seen some of the warmest years on record, with 2024, 2023, and 2016 topping the ranking.
Regional Differences in Temperature Rise
The rise and impact of global warming are not the same across the world. Some regions face more accelerated warming due to specific climate and weather conditions.
The highlighted observations are as follows:
- The Arctic has warmed at a rate nearly four times the global average, leading to significant ice melt and ecosystem disruptions.
- Continental regions such as North America, Europe, and Asia have experienced significant increases in extreme weather events, such as compound droughts and heatwaves.
- Oceans have absorbed much of the excess heat, contributing to rising sea levels and more frequent and intense hurricanes.
Global Warming and Greenhouse Gases

Greenhouse gas emissions, particularly methane, nitrous oxide, and carbon dioxide (CO2), are the main driver of global warming. Human activities are the dominant force behind rising CO2 concentrations, accounting for 55.4% of total emissions. Industrialization and urbanization have also contributed significantly to localized warming, known as the urban heat island effect.
Natural emissions play a role, too, ranging from 18.13 to 39.30 gigatonnes of CO2 equivalent (Gt CO2-eq) annually, with a likely value around 29.07 Gt CO2-eq. Key natural sources of emissions include forest fires, oceans, wetlands, permafrost, volcanoes, and earthquakes.
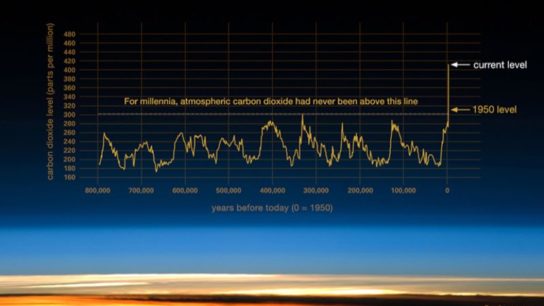
CO2 levels reached approximately 420 parts per million (ppm) in 2023 – the highest value since records began. That year was also the warmest year within the last century, until 2024 – currently the hottest on record.
Deforestation and land-use changes have further reduced the planet’s ability to absorb CO2, intensifying the temperature rise. Forests, like oceans, are invaluable carbon sinks, absorbing and storing large quantities of CO2 from the atmosphere.
Soil holds carbon in forms like permafrost or peat, but temperature rise makes it hotter and drier, making it more difficult to store more carbon.
In the oceans, one of the main players in carbon absorption is phytoplankton, microscopic bacteria that consume CO2 and release oxygen. However, high concentrations of microplastics in the water disrupt the structure of algal communities, which negatively affects the entire marine ecosystem. Plants absorb CO2 thanks to a process called photosynthesis. With the help of light, trees generate glucose – which they later use to produce cellulose and other things they need to grow – and oxygen, which they release into the atmosphere.
Predictions and Future Outlook

A polynomial regression model was used to make predictions for the next 25 years. While it fits the overall trend well, we can see slight underfitting around the years 2022 and 2023. This can be explained by a spike in anomaly that could not be captured by the model.
This means our predictions might be underestimated – in reality, the values could be much higher than forecasted. Nevertheless, we can still capture some valuable insights from the model’s predictions:
- If current patterns persist, we could see anomalies surpassing +2C by 2045, which crosses several critical climate thresholds.
- The model also predicts that we could breach the 1.5C anomaly as early as the 2030s – a major climate milestone referenced in the Paris Agreement.
Conclusion
Historical temperature time series affirm that, in the last century, global warming has accelerated, with much of this intensification attributed to anthropogenic activities. While the impact varies from place to place, what makes it truly alarming is the global nature of temperature rise.
The time left to halt greenhouse gas emissions, transition to carbon-free energy, and push for sustainable environmental policies is very limited.
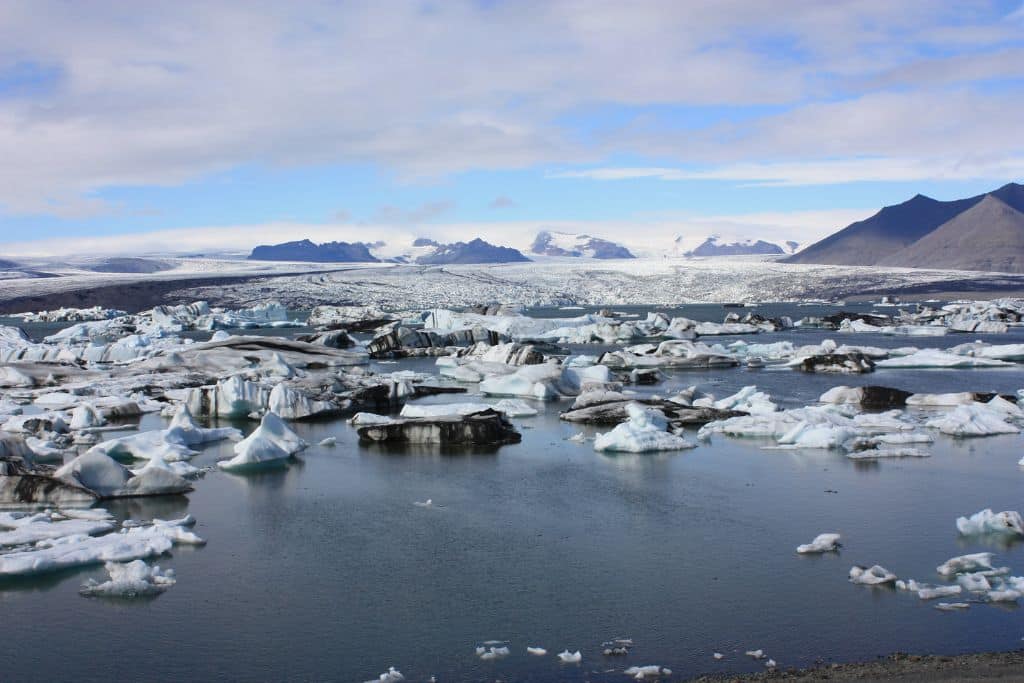
Featured image: Arian Zwegers/Flickr.
This story is funded by readers like you
Our non-profit newsroom provides climate coverage free of charge and advertising. Your one-off or monthly donations play a crucial role in supporting our operations, expanding our reach, and maintaining our editorial independence.
About EO | Mission Statement | Impact & Reach | Write for us


![The Statistics of Biodiversity Loss [2020 WWF Report]](https://earth.org/wp-content/uploads/2020/12/lprwinkyTHB-544x306.jpg)


